
INCIC cases ·
A dark core inside the enhancement: what is your diagnosis?
51-year-old man, in hospital for a late-presenting ST-elevation myocardial infarction treated with fibrinolysis. Cardiac MR in three short-axis slices: first-pass perfusion, late gadolinium enhancement and post-contrast cine. Hint: below, the T2 map of the same slice as the enhancement. What is the dark core inside the enhancement?
Case by Julián Vega Adauy · jvega@incic.org, Jesús Urbina Romero · jurbina@incic.org
PerfusionLate enhancementT2 mapHypointense core
What is your diagnosis?
Answer
Subacute infarction with microvascular obstruction and intramyocardial haemorrhage
InfarctionMicrovascular obstructionIntramyocardial haemorrhage
Delayed coronary angiography showed an occluded left anterior descending artery. Late enhancement shows an extensive transmural infarct (75–100% of wall thickness) in the proximal LAD territory: basal and mid anteroseptal, mid anterior, mid inferoseptal, mid anterolateral and apical segments, with extensive microvascular obstruction (the dark core). Perfusion shows an extensive defect matching the infarct, and early enhancement rules out intracavitary thrombus.
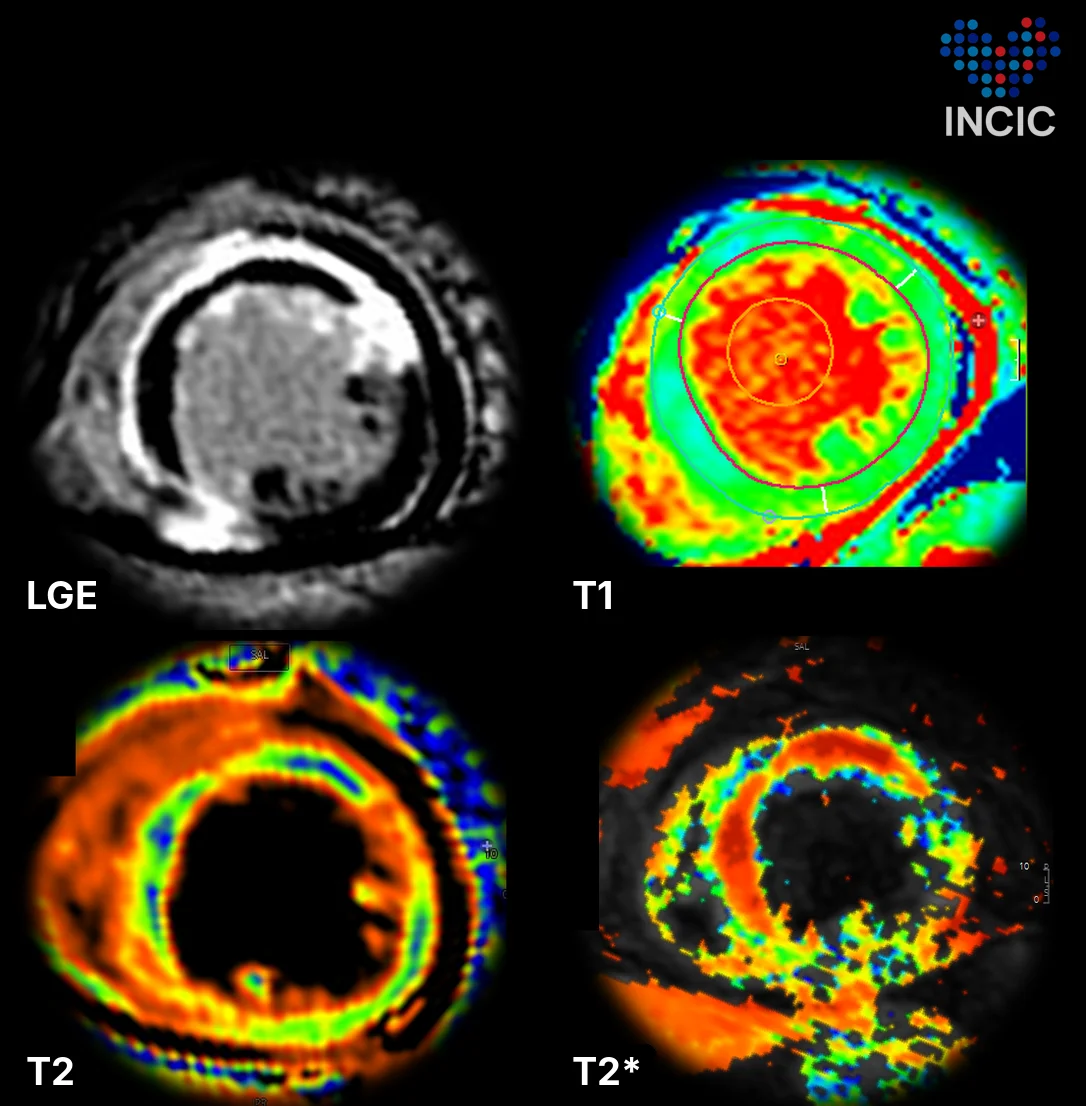
Parametric maps of the same mid short-axis slice show what lies inside that core:
- Native T1: areas of very low T1 inside the dark core. Remote myocardium: T1 1087 ms, extracellular volume 33% (increased).
- T2: areas of reduced T2 (33 ms) inside the dark core in the mid anterior wall, suggesting haemorrhage. Oedema (T2 71 ms in the mid anterior and anterolateral walls) is much smaller than the extent of enhancement, which points to a subacute infarct.
- T2*: areas of low T2* inside the dark core. Iron from extravasated blood shortens T2*: the signature of intramyocardial haemorrhage.
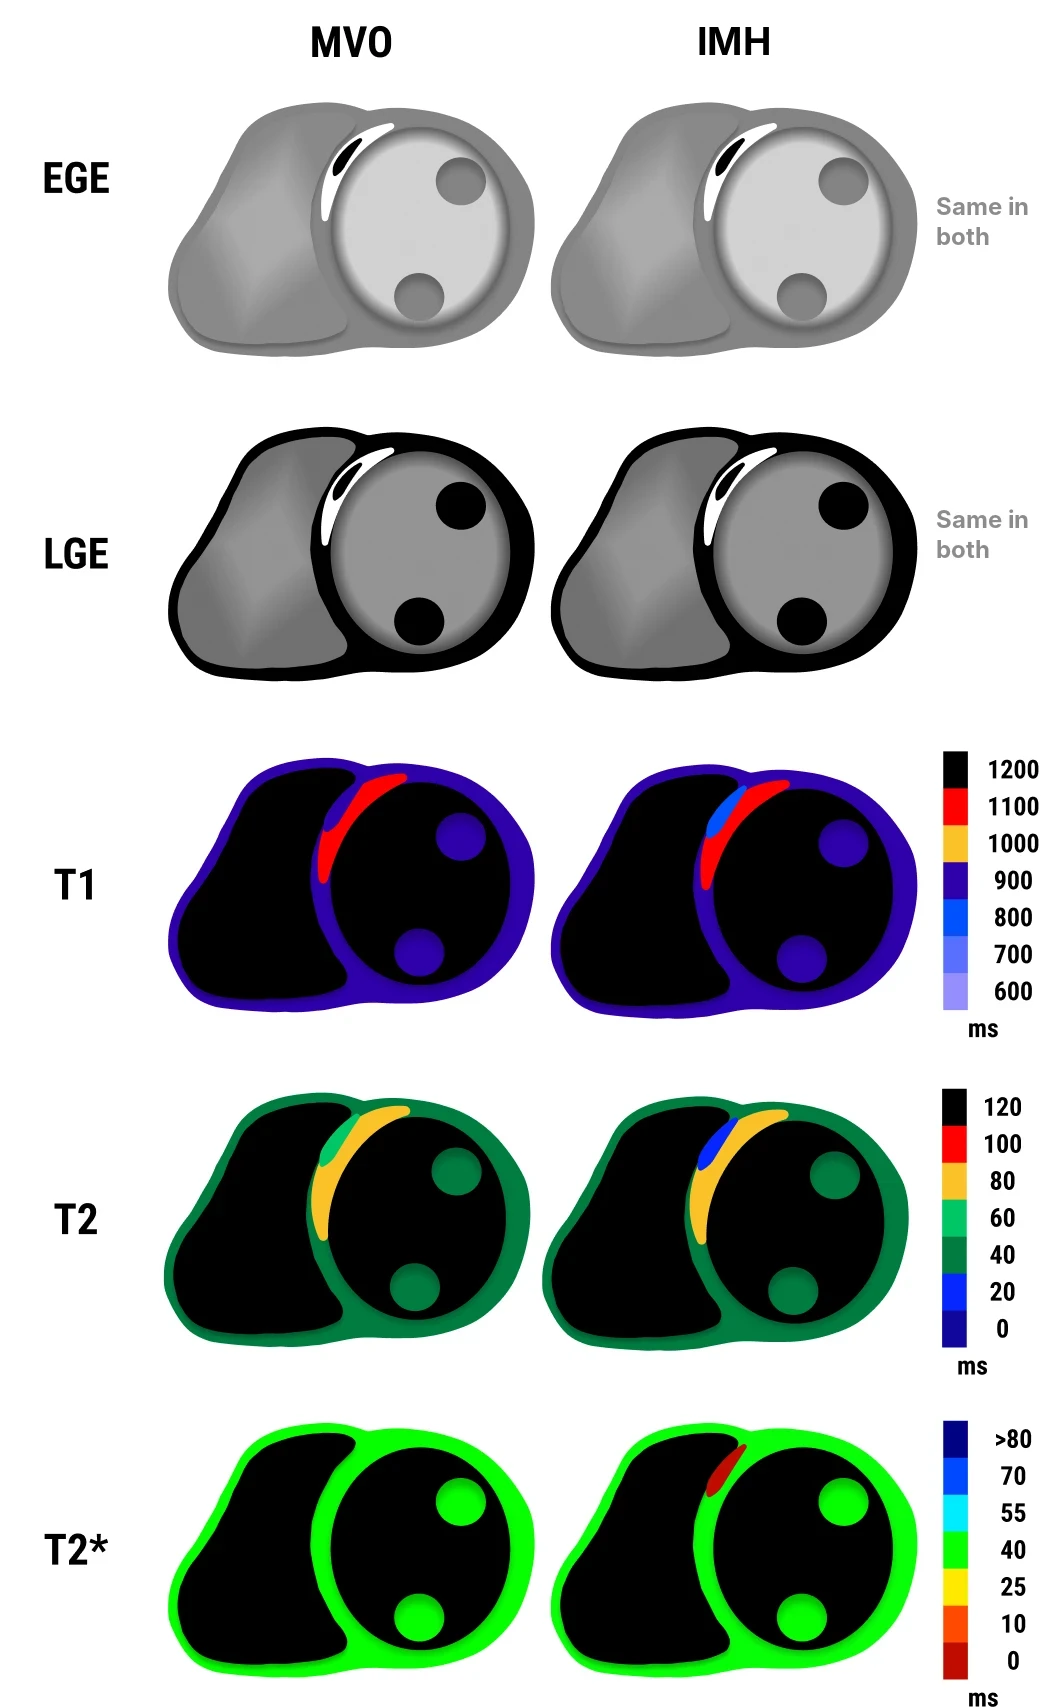
The diagram sums up how microvascular obstruction (MVO) and intramyocardial haemorrhage (IMH) look on each sequence: early and late enhancement are the same in both; the maps tell them apart.
The answer video shows the long-axis cines. The left ventricle has severe global systolic dysfunction (LVEF 19%), with severe hypokinesia of the anterior territory and apical akinesia. The right ventricle is not dilated and has moderate dysfunction (RVEF 32%). There is no residual viability.
Teaching points
- Enhancement alone cannot tell them apart. Microvascular obstruction and intramyocardial haemorrhage look the same on perfusion, early and late enhancement: a hypointense core surrounded by enhancement. In haemorrhage the core borders tend to be smoother.
- T2* is the key. In isolated microvascular obstruction T2* is normal (~40–60 ms); in haemorrhage it is markedly reduced (<20 ms).
- Low T1 and T2 point the way. In microvascular obstruction native T1 and T2 pseudo-normalise (~900 ms and ~40–50 ms). In haemorrhage, paramagnetic iron lowers them (T1 ~700–800 ms, T2 <35 ms).
- Timing matters. Microvascular obstruction appears right after reperfusion. Haemorrhage peaks 2–3 days after the infarct and tends to resolve by 4–6 weeks.
- Why it matters. Microvascular obstruction marks failed microcirculatory reperfusion (40–60% of reperfused infarcts). Haemorrhage occurs in ~20% of infarcts, almost always together with microvascular obstruction, and is associated with adverse remodelling and risk of aneurysm. In this patient they indicate irreversible microvascular damage; the feared remodelling is an extensive ventricular aneurysm. A follow-up CMR at 3 months was suggested.